|
|
||
FROM: A course on buckling of structures:
http://www.colorado.edu/engineering/CAS/courses.d/Structures.d/IAST.Lect26.d/IAST.Lect26.pdf
With respect to this image:
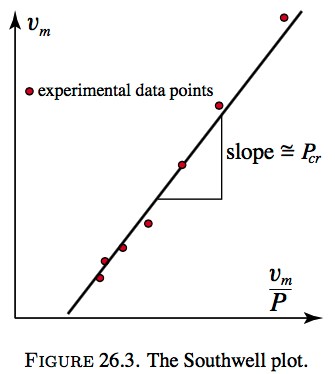
Let vm(P) denote a measured lateral deflection at load level P. Let Pcr = the buckling load. A finite lateral deflection vm exists because of structural imperfections or eccentric loading.
Southwell observed that the following approximation holds as P approaches Pcr : vm = a/(Pcr/P - 1), in which “a” is a constant. This equation for vm may be expressed in the form: vm = Pcr(vm/P) - a
If vm/P and vm are plotted along the x and y axis, respectively, the equation for vm becomes the equation of a straight line: y=mx−a, in which the slope m=Pcr. From measurements at several axial loads P < Pcr one obtains vm and vm/P as data points. These are plotted along the vertical and horizontal axes, respectively, as illustrated in this image.
This is the Southwell plot. A straight line is fitted to these points. Its slope estimates Pcr . The value of the constant “a” is of no importance.
This technique has the important advantage of being non-destructive because P need not exceed the critical load Pcr . For this reason it is often used in aerospace structures fabricated of expensive materials such as composites.
See: R. V. Southwell, On the Analysis of Experimental Observations in Problems of Elastic Stability, Proc. Roy. Soc. London, Series A, 135, pp. 601–616, April 1932.
Page 23 / 410