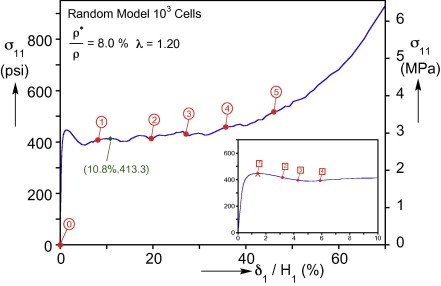
The points in red correspond to the images shown in the next 2 slides.From the same paper as the previous image
Page 232 / 410