|
|
||
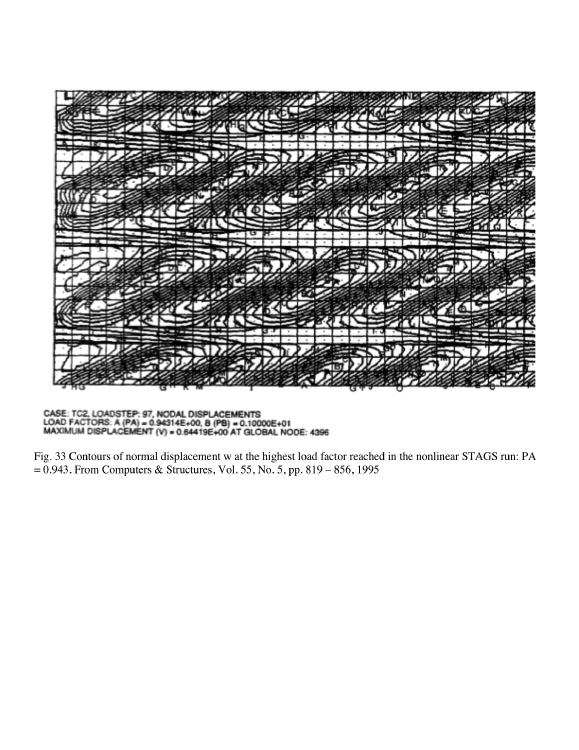
This is Fig. 33 from the 1995 p2stags paper. This slide shows contours of normal displacement w at the highest load factor reached in the nonlinear STAGS run: PA = 0.943. (PA = 1.0 is the design load factor.)
Compare the slopes of the post-buckled nodal lines shown in this figure with those shown in Fig. 26 (four slides ago) for the linear bifurcation buckling mode.
According to STAGS the slope of the buckling nodal lines increases as the panel is loaded further and further into its locally postbuckled state. This behavior confirms that predicted by the post-local-buckling analysis used in PANDA2.
(From Computers & Structures, Vol. 55, No. 5, pp. 819 – 856, 1995)
Page 48 / 49