|
|
||
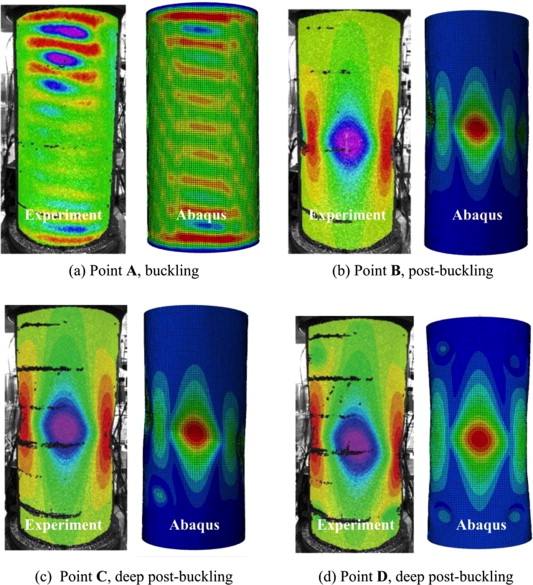
Fig. 11. Radial displacement (experimental) and displacement magnitude (simulation) color-maps of Shell A at different points on the loading cycle. The color-code for the experimental data is: red = +ve (outward), green = 0 and violet = −ve (inward).
From the same paper as the previous 2 images.
Page 61 / 444