|
|
||
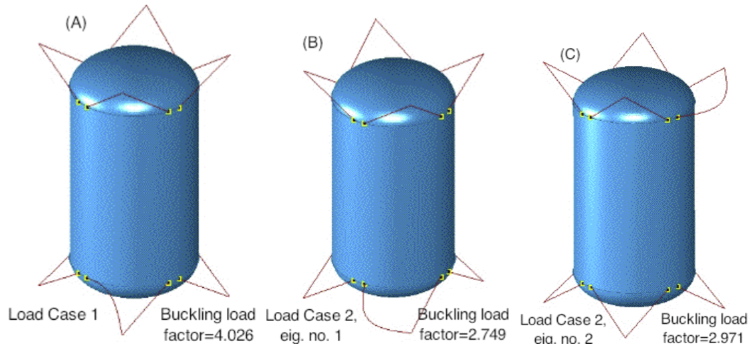
Fig. 30 from the 2013 GENOPT paper1. STAGS prediction of linear buckling of the tank/strut system. In each of the three frames the lowest buckling load factor corresponds to buckling of only one strut as a column. All of the three loading components, 10g acceleration with associated spatially linearly varying normal pressure head, 25 psi uniform internal pressure, and 200-degree tank cool-down, are included in Load Set A (“eigenvalue” loads) in these particular buckling analyses. There is no Load Set B.
(A) Buckling of one of the aft struts under 10g upward axial acceleration plus 25 psi internal pressure plus 200-degree tank cool-down (eigenvalue no. 1 for Load Case 1).
(B) Buckling of one of the aft struts under 10g lateral acceleration plus 25 psi internal pressure plus 200-degree tank cool-down (eigenvalue no. 1 for Load Case 2).
(C) Buckling of one of the forward struts under 10g lateral acceleration plus 25 psi internal pressure plus 200-degree tank cool-down (eigenvalue no. 2 for Load Case 2).
Note that Table 7(d) also includes STAGS predictions for buckling of the struts as columns. The STAGS predictions listed in Table 7(d) are obtained from models in which only one pinned strut is included in each STAGS model; the propellant tank is absent. Therefore, any possible influence of the flexibility of the propellant tank on the STAGS buckling load factors listed in Table 7(d) is neglected. Notice that the strut buckling load factors computed from the STAGS model of the tank/strut system depicted here are almost exactly the same as those listed in Table 7(d): 4.026 versus 3.99, 2.749 versus 2.74, and 2.971 versus 3.00. Therefore, according to predictions from STAGS, the flexibility of the propellant tank, included in the tank/strut system here, has virtually no influence on the buckling load factors predicted by STAGS.
The predictions from STAGS shown here are reasonably close to those predicted by GENOPT/TANK and listed in Table 7(d): 4.026 from STAGS versus 4.163 from GENOPT/TANK, 2.749 from STAGS versus 2.398 from GENOPT/TANK, 2.971 from STAGS versus 2.645 from GENOPT/TANK.
Page 110 / 190