|
|
||
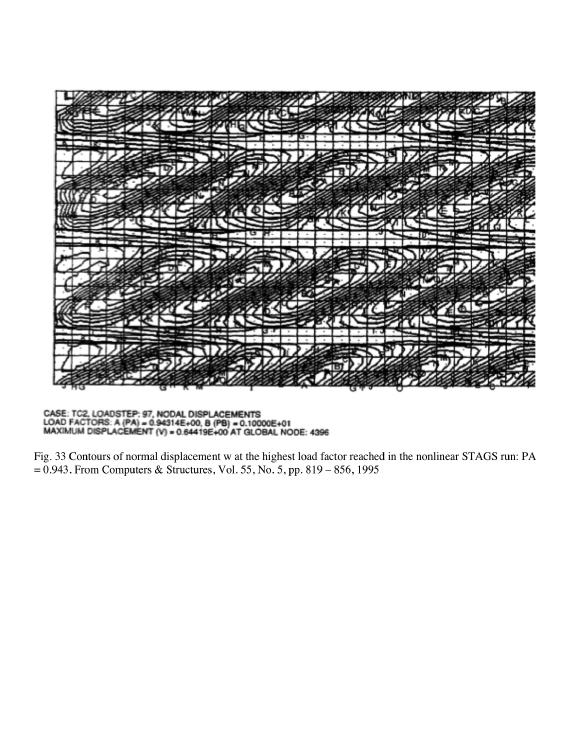
This is Fig. 33 from the 1995 PANDA2 paper. This slide shows contours of normal displacement w at the highest load factor reached in the nonlinear STAGS run: load factor, PA = 0.943. (PA = 1.0 is the design load factor.)
Compare the slopes of the post-buckled nodal lines shown in this figure with those shown in the previous slide for the linear bifurcation buckling mode.
According to STAGS the slope of the buckling nodal lines increases as the panel is loaded further and further into its locally postbuckled state. This behavior confirms that predicted by the post-local-buckling analysis used in PANDA2.
Figure 17 of the 1995 PANDA2 paper plots the slope of the local post-buckling nodal lines as a function of the applied in-plane shear load, Nxy.
For viewing figures and tables referred to here but not shown here, please download the appropriate paper (in this case the 1995 PANDA2 paper) from this website.
Page 7 / 35