|
|
||
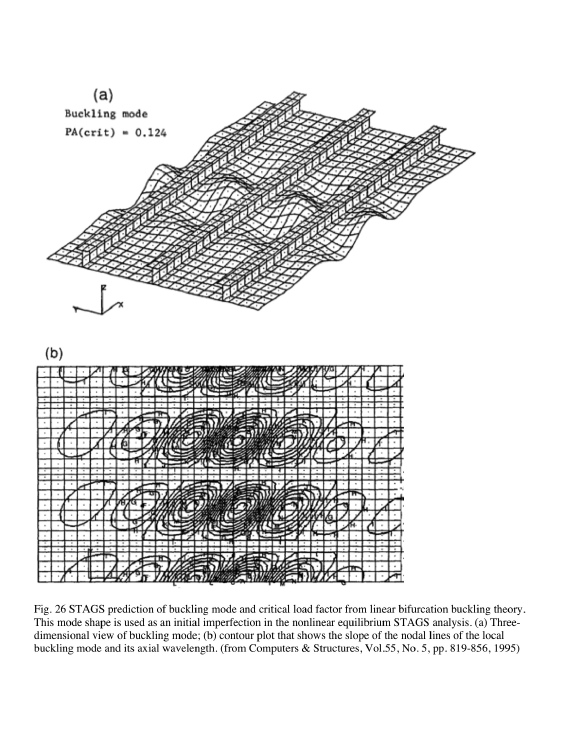
This is Fig. 26 from the 1995 PANDA2 paper. This slide shows the STAGS prediction of the buckling mode and critical load factor, PA, from linear bifurcation buckling theory of the T-stiffened panel shown in the previous slide.
This mode shape is used as an initial imperfection in the nonlinear equilibrium STAGS analysis that immediately follows the linear bifurcation buckling analysis.
Shown here are:
(a) Three-dimensional view of buckling mode
(b) Contour plot that shows the slope of the nodal lines of the local buckling mode and its axial wavelength.
PA is the load factor. PA(crit) is the linear bifurcation buckling load factor. PA = 1.0 is the "design load factor", that is, PA = 1.0 corresponds to the applied load for which the panel was previously optimized by PANDA2.
Since the linear bifurcation buckling load factor, PA(crit) = 0.124, this panel was optimized by PANDA2 for service in its far local post-buckling regime.
The local buckles appear only in the neighborhood of the midlength of the panel because the pressure component of loading bends the stiffened panel upward so that the axial compression in the panel skin is maximum at the panel midlength.
Page 6 / 35