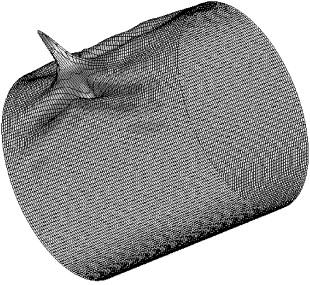
Fig.12 First eigenmode for the same imperfect shell at the limit load. This pattern represents the growth (rate of change) of the deforamtion at the limit load
../fullsize/stagscylrandomimp.jpg
../mediafiles/l93.jpg
Fig.12 First eigenmode for the same imperfect shell at the limit load. This pattern represents the growth (rate of change) of the deforamtion at the limit load
From the same paper as the previous three slides.
Page 93 / 444